Add chart method present in slide component or you can replace the chart using shape component.
Basic Code Sample
Section titled “Basic Code Sample”using G = OpenXMLOffice.Global_2007;
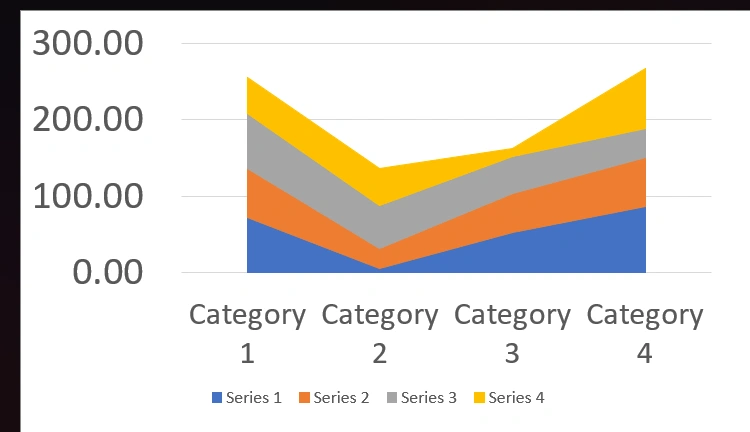
// Bare minimumpowerPoint.AddSlide(PresentationConstants.SlideLayoutType.BLANK) .AddChart(CreateDataCellPayload(), new G.AreaChartSetting<G.PresentationSetting>());// Some additional samplespowerPoint.AddSlide(PresentationConstants.SlideLayoutType.BLANK) .AddChart(CreateDataCellPayload(), new G.AreaChartSetting<G.PresentationSetting>() { areaChartTypes = G.AreaChartTypes.STACKED, chartAxesOptions = new() { horizontalFontSize = 20, verticalFontSize = 25 } });AreaChartSetting<G.PresentationSetting> Options
Section titled “AreaChartSetting<G.PresentationSetting> Options”Contains options details extended from ChartSetting that are specific to area chart.
| Property | Type | Details |
|---|---|---|
| areaChartDataLabel | AreaChartDataLabel | General Data label option applied for all series |
| areaChartSeriesSettings | List<AreaChartSeriesSetting?> | Data Series specific options are used from the list. The position on the list is matched with the data series position. you can use null to skip a series |
| areaChartTypes | AreaChartTypes | Type of chart |
| chartAxesOptions | ChartAxesOptions | Chart axes options |
AreaChartDataLabel Options
Section titled “AreaChartDataLabel Options”Contains options details extended from ChartDataLabel that are specific to area chart.
| Property | Type | Details |
|---|---|---|
| dataLabelPosition | DataLabelPositionValues | Data Label placement options. |
AreaChartSeriesSetting Options
Section titled “AreaChartSeriesSetting Options”Contains options details extended from ChartSeriesSetting that are specific to area chart.
| areaChartDataLabel | AreaChartDataLabel | Data Label Option specific to one series |
| fillColor | string? | Fill color specific to one series |